Green Initiative
Management and Science University (MSU) has made significant strides toward establishing a low-carbon campus, demonstrating a strong commitment to sustainability and environmental stewardship. Central to this vision is MSU’s commitment to achieving net-zero carbon emissions by 2050. The university's efforts are evident through various initiatives and recognitions aimed at reducing carbon emissions and promoting sustainable practices.
In 2020, MSU achieved a notable milestone by earning a Diamond-2 rating in the Sustainable Energy Development Authority (SEDA) Malaysia Sustainable Energy Low Carbon Building Assessment. This accolade reflects the university's dedication to sustainable building practices, resulting in a 24.21% reduction in emissions compared to baseline measurements in 2019. This reduction translates to an annual saving of 5,646,661 kWh or 3,918.78 tonnes of carbon dioxide in 2020, aligning MSU with Malaysia's national target of a 40-45% reduction in CO₂ emissions by 2030.
MSU's commitment to sustainability is further exemplified by its participation in the Shah Alam Low Carbon City initiative. This program aims for a 45% absolute reduction in greenhouse gas emissions by 2035, promoting low-carbon lifestyles and addressing climate change challenges within the city. The initiative is part of Shah Alam's broader strategy to become a sustainable and resilient city by 2030, involving various stakeholders, including educational institutions like MSU, to collaboratively achieve these environmental goals.
Through these concerted efforts, Management and Science University not only advances its sustainability objectives but also contributes meaningfully to Malaysia's environmental targets and the global agenda for sustainable development.
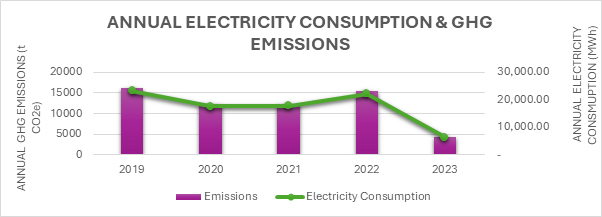
In 2019, MSU recorded its highest electricity consumption and GHG emissions, serving as the reference point for evaluating subsequent sustainability efforts. From 2020 to 2022, the university saw moderate reductions and fluctuations in both energy use and emissions. However, energy consumption remained relatively high, with GHG emissions still significantly above desired reduction targets.
A notable turning point occurred in 2023, following MSU’s subscription to the Green Energy Tariff (GET) offered by TNB Malaysia, which began in April 2023. Under this initiative, MSU procured 1.5 million kWh of renewable energy, shifting a portion of its electricity consumption to clean, certified green energy sources.
As a result, both electricity consumption and GHG emissions saw a dramatic drop in 2023 and continued into 2024. This shift not only demonstrates improved energy efficiency but also reflects the environmental benefits of reducing reliance on fossil fuels.
By using 2019 as the benchmark, the data clearly shows MSU’s steady progress toward becoming a low-carbon campus, aligning with national climate objectives and reinforcing its role as a sustainability-driven institution.
SCOPE 1 EMISSION
Scope 1 refers to direct greenhouse gas (GHG) emissions from owned or controlled sources such as university vehicles and backup generators. Based on the fuel consumption data for 2024, Management and Science University (MSU) recorded a total of 14,991.14 litres of fuel usage under Scope 1 emissions.
This data comprises the cumulative fuel usage across multiple university-owned vehicles over the span of 12 months, covering diesel and petrol consumption. The accurate tracking and reporting of Scope 1 emissions are vital for MSU’s commitment to sustainability and transparency under its low carbon campus initiative.
SCOPE 2 EMISSION
Scope 2 emissions are indirect GHG emissions that result from the consumption of purchased electricity, steam, heating, and cooling. The chart titled "Scope 2 Carbon Emission", MSU’s monthly indirect carbon emissions from purchased electricity in 2024 varied throughout the year.
The highest emissions were recorded in October, at 601,055 kgCO₂e, likely due to increased campus activity or environmental conditions requiring more energy for cooling. The lowest emissions occurred in February, at 280,139 kgCO₂e, possibly linked to lower operational hours or improved energy efficiency. There was a significant spike during the months of March, May, and July, each exceeding 540,000 kgCO₂e, showing peak electricity usage.